
Kenya’s fertilizer market is heavily import-dependent, but local fertilizer manufacturing in Kenya carries a fundamentally different cost structure than importing finished product — one that investors must model carefully before choosing a business model.
Kenya’s import dependence today
Kenya imported approximately 657,730 metric tonnes of fertilizer in 2022, with the value of fertilizer imports reaching roughly US$451 million in 2023. A TechnoServe study prepared for the UK’s FCDO found Kenya imports approximately 95% of its fertilizer, with clearance fees, transport, and mark-ups together accounting for roughly 30% of the consumer price. This structural dependence means import-side businesses are exposed to currency, freight, and global-price shocks well beyond their control. Read the source…
Why import margins are structurally thin
Kenya’s Competition Authority market inquiry found agro-dealer mark-ups of roughly KSh 200 or less per 50kg bag, with overall importer margins ranging between approximately 2.5% and 10%, and an industry-cited general margin of around 5%. An earlier IFDC fertilizer assessment similarly found agro-dealer gross margins of only 2–4% of cost, largely because of the high working capital tied up in bulky fertilizer inventory. These thin margins leave importers and distributors highly exposed to input-cost volatility with little pricing cushion. (Source : Non-Confidential Final Report : Market Inquiry on Fertilizer in Kenya, by Competition Authority of Kenya and Centre for Competition, Regulation and Economic Development, University of Johannesburg, 2015)
Currency and global shocks amplify the risk
The average landed cost of fertilizer in Kenya rose 56% in a single year — from KSh 32,789 to KSh 51,168 per metric tonne — following the Russia-Ukraine conflict’s disruption of global fertilizer supply, according to Kenya National Bureau of Statistics data reported by Business Daily Africa. FOB fertilizer prices reportedly doubled following the same disruption, directly constraining supply and cost across the import chain.
Local manufacturing: a different cost structure
A local organic or biofertilizer facility replaces import-driven cost exposure with capital-intensive, controllable domestic costs. Typical cost components include:
- Land, civil works and site development
- Feedstock sourcing, collection and transport
- Composting, fermentation, granulation and packing equipment
- Laboratory testing and quality-control systems
- Registration, licensing and compliance costs
- Staff training, distributor development and demonstration programs
Kenya’s regulatory framework requires any fertilizer manufacturing or production plant to register with the relevant Board, submitting a written feasibility plan and raw-material composition documentation; the Board must issue its evaluation report within 90 working days of a complete application.
Costs vs. import margins: a side-by-side view
| Factor | Importing finished fertilizer | Local manufacturing |
|---|---|---|
| Primary cost exposure | FOB price, ocean freight, forex, port clearance | Land, equipment, feedstock, working capital |
| Typical margin | Approx. 2.5–10% (importer/distributor) | Depends on feedstock cost and product differentiation |
| Currency risk | High — landed cost tied to international pricing businessdailyafrica | Lower once feedstock is domestically sourced |
| Capital requirement upfront | Lower (working capital for inventory) | Higher (capex for plant and equipment) |
| Regulatory pathway | Distribution/import licensing | Separate manufacturing plant registration |
Manufacturing, blending, and distribution are different businesses
- Manufacturing converts raw feedstock into finished organic fertilizer or biofertilizer and requires plant registration under Kenya’s fertilizer regulations.
- Blending/formulation combines or enriches already-processed inputs and may carry separate classification requirements depending on the final product.
- Distribution sells finished product to farmers or agro-dealers and requires a distributor license rather than manufacturing registration.
Investors should be clear about which activity they intend to pursue, since each carries a distinct capital profile and regulatory pathway.
Where India–Kenya joint ventures fit
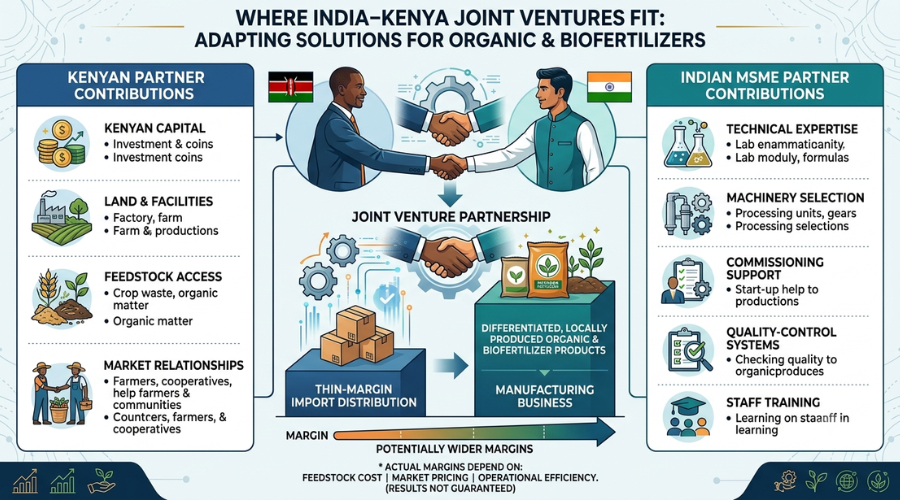
A joint-venture structure can combine Kenyan capital, land, feedstock access and market relationships with Indian MSME technical expertise in formulation, machinery selection, commissioning support, quality-control systems, and staff training. This model allows a Kenyan investor to move from thin-margin import distribution toward a manufacturing business with potentially wider margins on differentiated, locally produced organic and biofertilizer products — though actual margins depend on feedstock cost, market pricing, and operational efficiency, and cannot be guaranteed.
Regulatory and feasibility caution
Fertilizer manufacturing registration requirements, import cost structures, and margin levels are subject to change and vary by product category, location, and market conditions. This article does not constitute financial, legal, or investment advice. Prospective investors should verify current fertilizer registration requirements with Kenya’s relevant regulatory board and commission an independent, project-specific feasibility study — covering feedstock costs, capital expenditure, and realistic market pricing — before committing capital to either an import or manufacturing model.
Weighing the costs of local fertilizer manufacturing against import-distribution margins in Kenya?
Gondwana Treasures helps connect Kenyan and East African investors with experienced Indian MSME technical partners for organic fertilizer and biofertilizer manufacturing joint ventures — supporting formulation guidance, plant setup coordination, and cost-structure planning. Contact Gondwana Treasures to discuss your target location, product category, and joint-venture requirements.